CONTACT US

Data Visualization

Transform Data into Compelling Visual Stories.

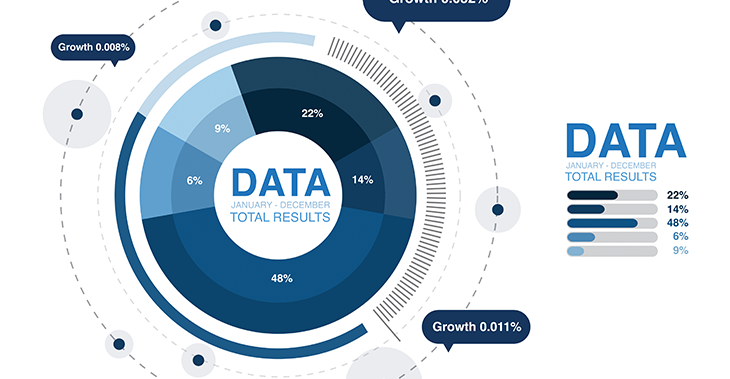
Data Visualization service helps you unlock the potential of your data by transforming complex information into stunning visuals that tell a story. Whether you need interactive dashboards, insightful infographics, or analytical reports, we craft tailored visual solutions that enhance understanding and drive impactful business strategies. Let us help you elevate your data into a visual experience that captivates and informs your audience!

Unlock the Magic of Data Visualization!
  • Interactive dashboards for real-time insights.

  • Visually striking infographics for effective communication.

  • Comprehensive reports for informed decision-making.

  • User-focused designs for seamless data engagement.


Frequently Ask Questions

To clarify how our Data Visualization services can transform your data into actionable insights, we have compiled a list of frequently asked questions. Our goal is to ensure that you feel confident in leveraging data visualization to drive your business forward.

What are the benefits of data visualization?

Data visualization simplifies complex data sets, making it easier to identify trends, patterns, and outliers. It enhances comprehension, supports data-driven decision-making, and encourages stakeholder engagement.

What types of data visualization do you offer?

We provide a variety of visualization options, including interactive dashboards, charts, graphs, infographics, and maps, tailored to fit your specific data and business needs.

How do you ensure the accuracy of the visualizations?

We follow a rigorous process to validate data sources and ensure that visual representations are both accurate and meaningful. Our team retains close collaboration with you to ensure the visualizations align with your expectations.

Can you integrate data from multiple sources?

Absolutely! We excel in consolidating data from various sources, whether it’s spreadsheets, databases, or APIs, to create comprehensive visualizations that provide a holistic view of your metrics.

How do I get started with your Data Visualization services?

Getting started is simple! Contact us to schedule a consultation, and we’ll discuss your visualization needs, data sources, and goals to craft a customized approach that best serves your business.

Request a free quote.

Call Us

+2347062649450

Email

teprim93@gmail.com

Visit Us

Olajide Plaza Opp Model College Badore, Lekki-Ajah, Lagos.

Privacy Settings
We use cookies to enhance your experience while using our website. If you are using our Services via a browser you can restrict, block or remove cookies through your web browser settings. We also use content and scripts from third parties that may use tracking technologies. You can selectively provide your consent below to allow such third party embeds. For complete information about the cookies we use, data we collect and how we process them, please check our Privacy Policy
Youtube
Consent to display content from - Youtube
Vimeo
Consent to display content from - Vimeo
Google Maps
Consent to display content from - Google
Spotify
Consent to display content from - Spotify
Sound Cloud
Consent to display content from - Sound